Part Two – How New Zealanders use the Internet
Measures that demonstrate how we use the Internet in New Zealand – to entertain, to buy and to access our Government
The Internet is a great tool for humans to connect with one another, do things together, buy and sell things, argue, connect, watch, experience and even find love.
So how are New Zealanders using the Internet?
Part two: Cut to the chase
Taken together, we see the following themes about New Zealanders' use of the Internet:
- We're using the Internet more, and our data needs are growing. We are watching TV and listening to music online through streaming services, rather than file sharing, and we are banking online and using social media a lot.
- New Zealanders are buying and selling things online, but many of our businesses are not using the potential of the Internet to their benefit.
- We don't have the data on how successful the Government's move to online services and engagement has been, but if the Better Public Services - Result Areas 9 & 10 bear fruit we may have more soon.
Overview
This section illustrates at a high level how New Zealanders are using the Internet, and for what purposes. As national Internet infrastructure improvements such as the Ultra-Fast Broadband (UFB) programme and Rural Broadband Initiative (RBI) roll-out to progressively connect ever more New Zealand homes (see Part One) conversations about effective utilisation of this infrastructure are increasingly coming to the fore. Use of the Internet, whether for economic or social ends, is where the value of these infrastructure programmes will be realised.
Unfortunately, much of the data available about use is only available until 2012. Therefore, this section of this State of the Internet Report is a bit shorter than we were hoping. This highlights one of the key challenges in preparing this report - that Statistics New Zealand is no longer collecting/publishing data of this nature. We think that that's a missed opportunity to gain official statistical insight into how the usage habits of New Zealanders may be changing, at a particularly relevant time as the UFB and RBI programmes gain steam.
We will update this section in future editions of the State of the Internet report as more information becomes available. One likely source in future editions is the World Internet Project New Zealand Survey, We are also keen to hear suggestions for other quality metrics that we could build in that may provide more detailed and more recent updates.
Our insight
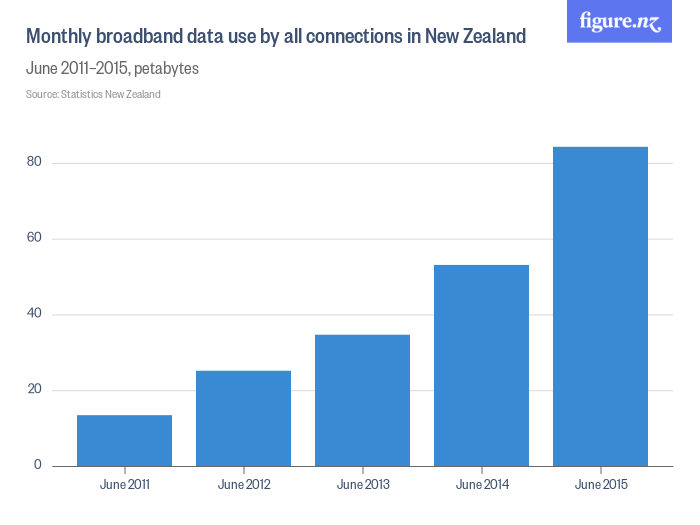
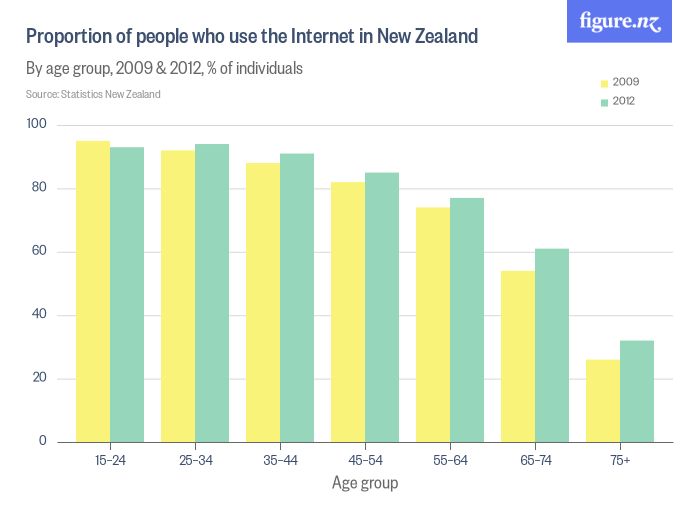
Since 2011, monthly broadband data use has gone up over 400%. The 2009-2012 data looking at the proportion of age groups that use the Internet shows a small increase. Given the slow rate of change in the number of people using the Internet in New Zealand, this is potentially explained by Internet usage reaching saturation point in most age group. More data in future editions of this report will likely confirm this hypothesis.
This data explosion has coincided with the introduction of ever more content distribution options for streaming of both video and audio. These consumption-type services, providing additional competition in the content market, are good examples of recreationally beneficial uses of Internet infrastructure. More detailed data would be useful to explore to what degree this correlation with content distribution services is valid, and whether there are other behaviours growing as well.
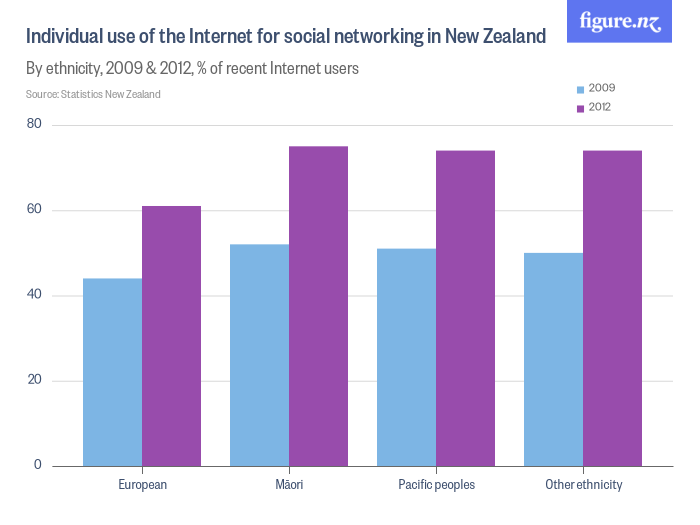
Individual use
Our insight
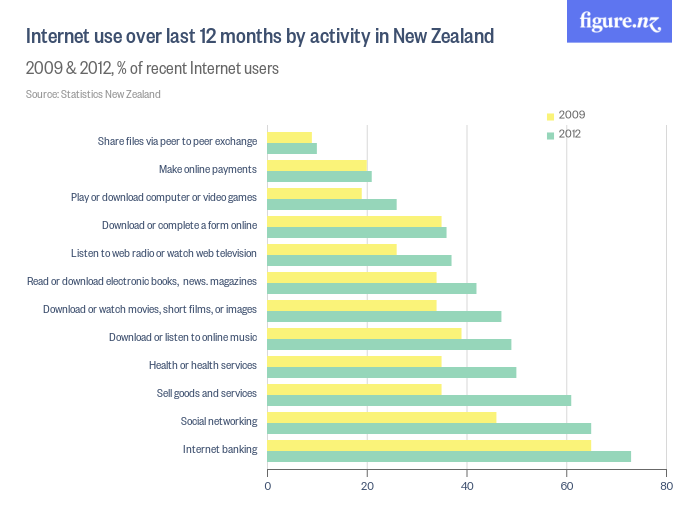
Between 2009 and 2012, all categories of Internet use increased. These two graphs highlight that not only were Internet banking, social networking, selling goods or services and Voice over IP (VoIP) services the most common uses of the Internet by New Zealanders in 2012, but that these were also the types of use that had some of the largest increases since 2009.
These are particular data points in which we are really missing more recent data around how behaviours are changing, with regard to the questions we ask about economically and socially productive use of the Internet. We can take some comfort from the 'selling goods or services' category though, which shows the growth and the realised potential of Internet commerce in New Zealand. There remains opportunities here; for example, research from the Innovation Partnership shows:
Businesses are much less developed in receiving orders online, with 45% reporting doing so in 2012 (most of which is by email), and only 11% reporting that online sales contributed 10% or more of total sales. Only 10% of businesses report any sales to customers outside New Zealand, 19% allow ordering of goods and services via their websites, and 12% of businesses accept online payments.
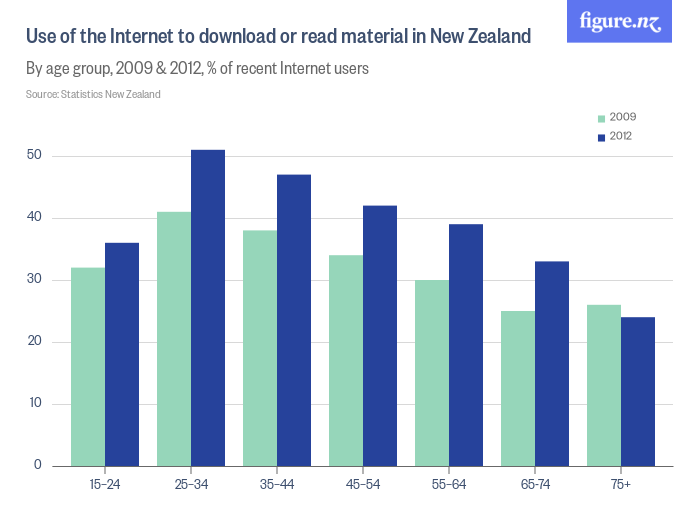
Entertainment and media
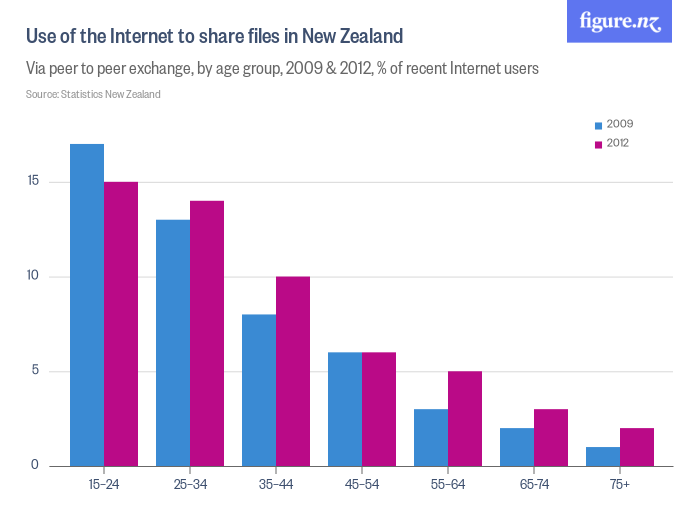
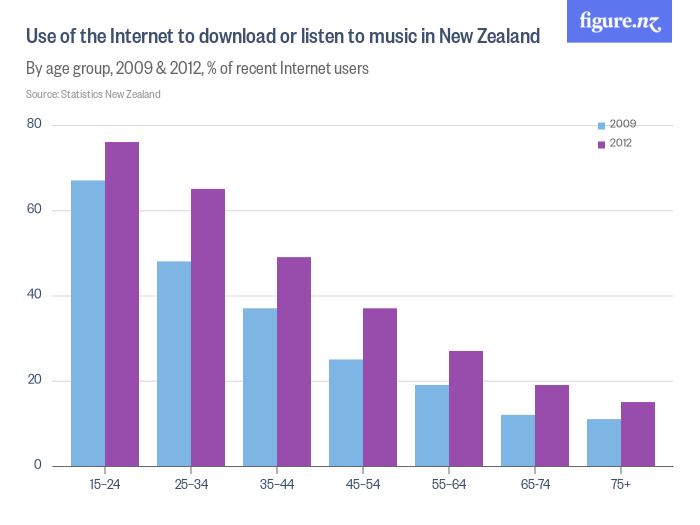
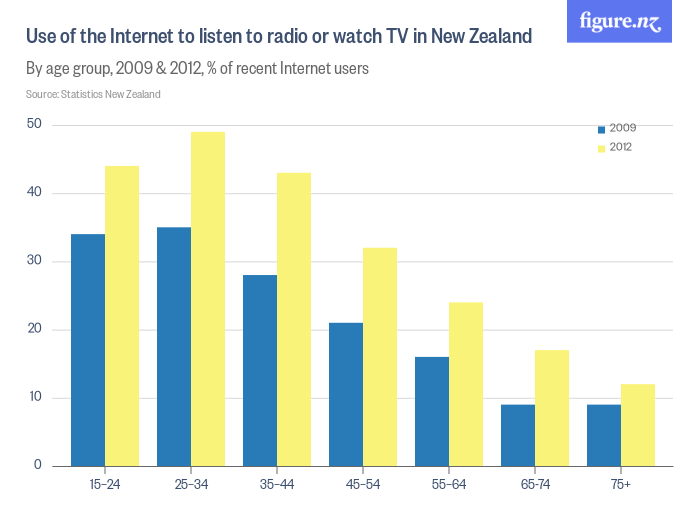

Our insight
Of no surprise is that young New Zealanders are the most prolific users of the Internet to listen to music and share files. While there are many legitimate uses of file sharing technology, it will be interesting to see more recent statistics to see whether file sharing use has gone down. Since 2012, New Zealanders have got much better access to options to pay for TV and movies over the Internet with Lightbox, Netflix and Neon all entering the market. In the music industry, streaming services like Spotify and Apple Music have made inroads into how New Zealanders use the Internet to listen to, as well as purchase, music.
Unsurprisingly, more people are using the Internet to listen to music and watch TV and movies, as the charts above show. We are interested in finding datasets that may demonstrate whether this increase in legitimate content-distribution channels has had an impact on file-sharing over the Internet, to explore how this dynamic may be working in New Zealand.
Commerce
Our insight
The three years between 2009 and 2012 saw considerable growth in selling goods and services over the Internet across all age groups. What is of note is that, by 2012, over half of each of the different working-age groups were using the Internet to sell goods and services. It will be interesting to see if 2012 to 2016 has seen a similar level of growth.
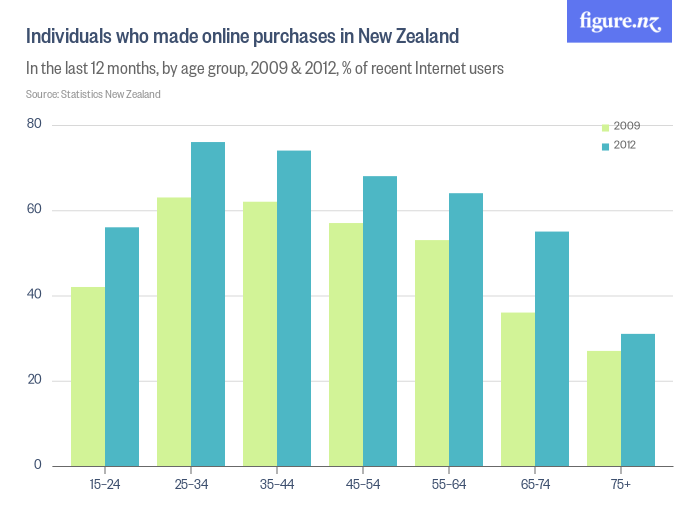
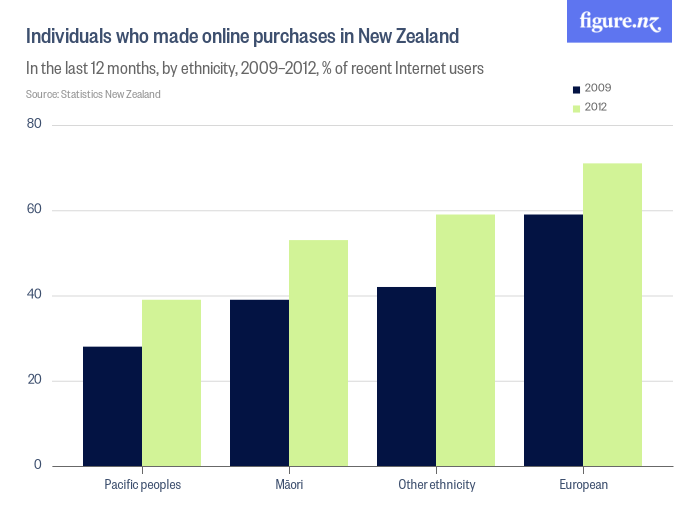
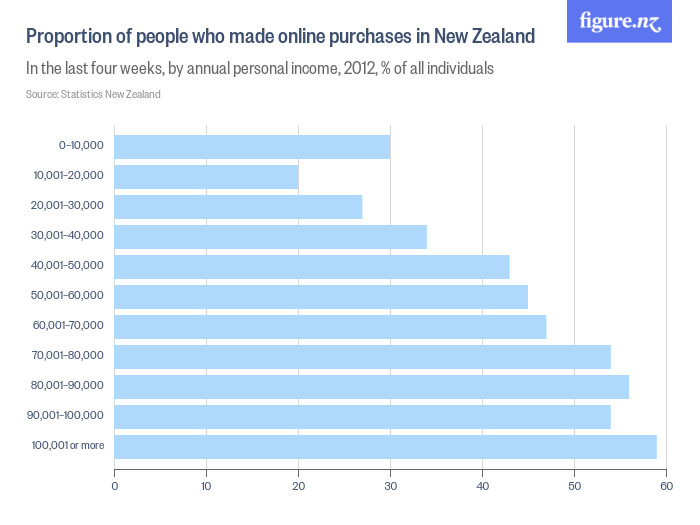
Our insight By 2012 the majority of all working-aged New Zealanders were making online purchases and many had made an online purchase in the last four weeks. This is not surprising and we anticipate that this will have grown further since 2012.
What is of more interest is the lower rate of Pacific peoples use of the Internet to purchase items. We would be concerned to see a similar gap between Pacific peoples and other New Zealanders continuing in more recent data sets. The socio-economic gradient is also not surprising, representing another facet of the digital divide in New Zealand.
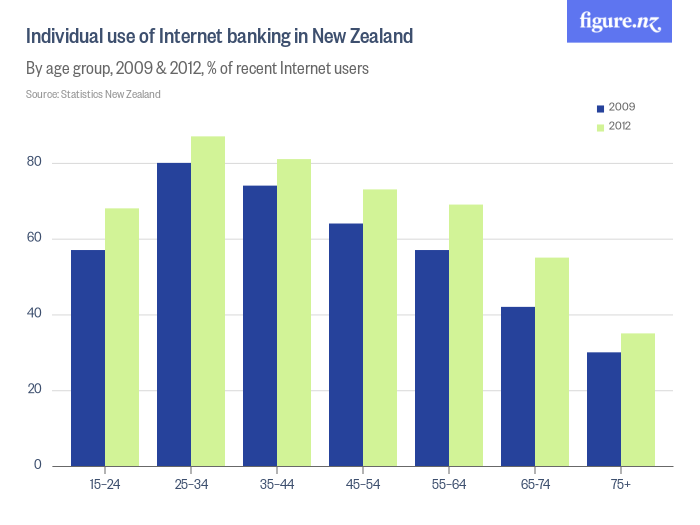
Our insight
Internet banking is commonplace, and the rising use of mobiles mirrors the general trend of increased use of the Internet generally. Between 2009-2012, the use of Internet-capable smartphones took off. This chart does not show a distinction between mobile Internet banking and desktop access, but we'd expect that given this trend in changing Internet use habits driven by smartphone adoption, that such a breakdown would show less desktop use and more on mobiles.
For example, in 2014 ASB noted that customers were doing more banking through mobile apps than through traditional online banking platforms. You can see this article here:
Government services
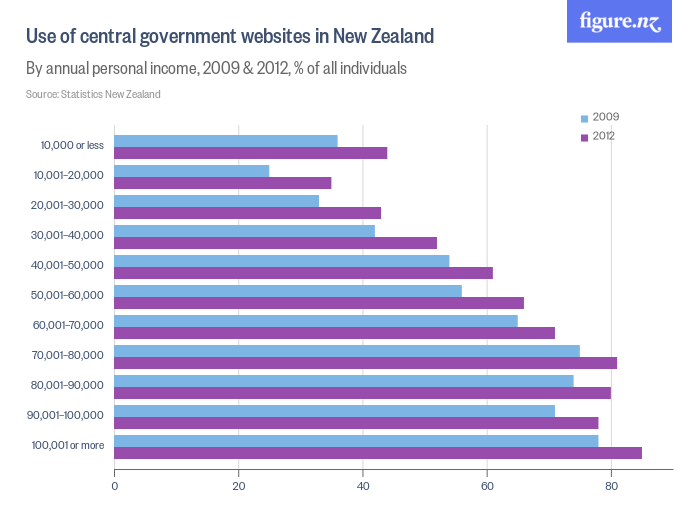
Our insight
These stats are likely low and should have changed considerably in the last four years. Since 2012, the Government's Better Public Service results have included two targets for government agencies to provide services online. Again, the rising use is consistent with the general trend of increased Internet use across the board.
We will be seeking to identify further data sets looking at how much more New Zealanders are dealing with government agencies online, and ideally, how positive those experiences are. Again, we welcome pointers to any such data sets that may be available to explore this.
Education sector
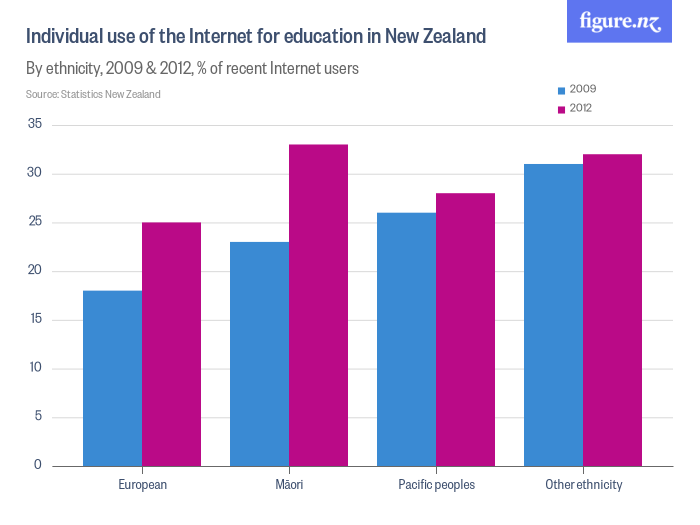
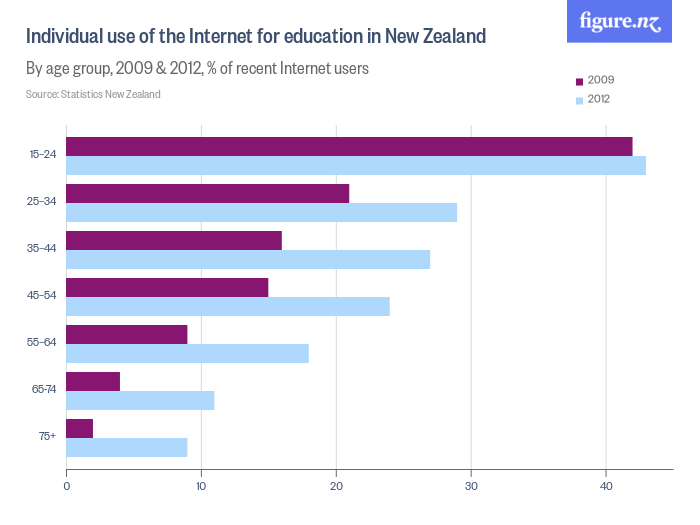
Our insight
Unsurprisingly, the age category with the highest proportion of people actively engaged in education (15-24) also outstrips other age groups for using the Internet for education. The very significant increases in all other age groups is also of interest. Massive Online Only Courses (MOOCs) were only just becoming popular in 2012. It will be interesting to see how much uptake of MOOCs by New Zealanders, and moving to online teaching platforms by New Zealand institutions will have impacted how New Zealanders use the Internet for education.
Internet and voting
Voting online and the impact of the Internet on politics have attracted attention in New Zealand in the past few years. Preparations are underway for trials of online voting in local body elections. How do New Zealanders feel about voting over the Internet?
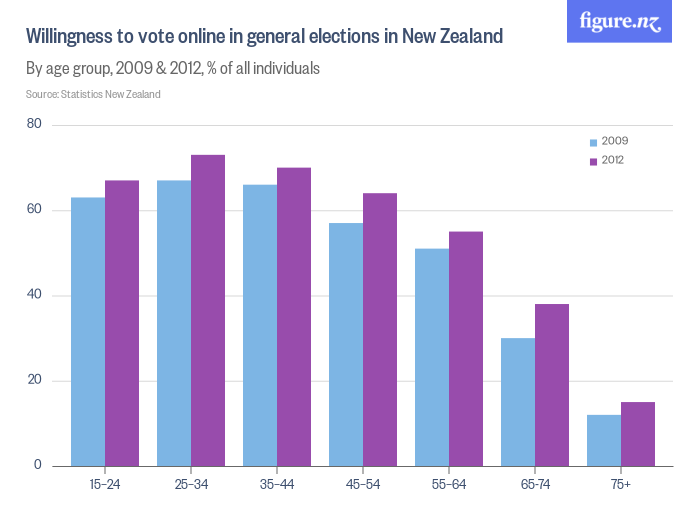
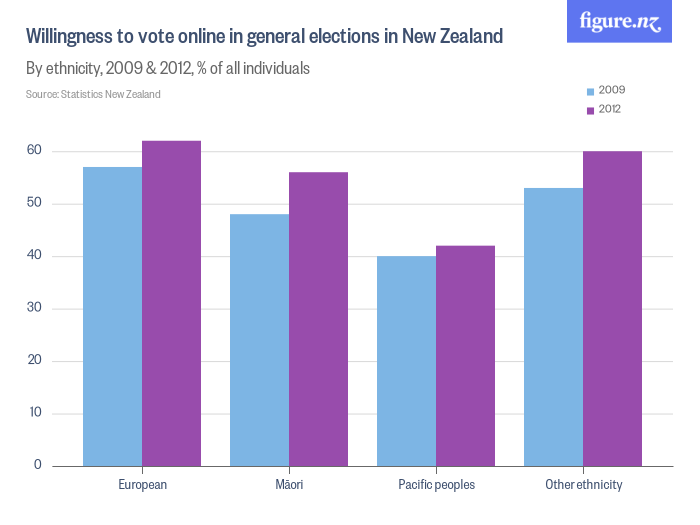
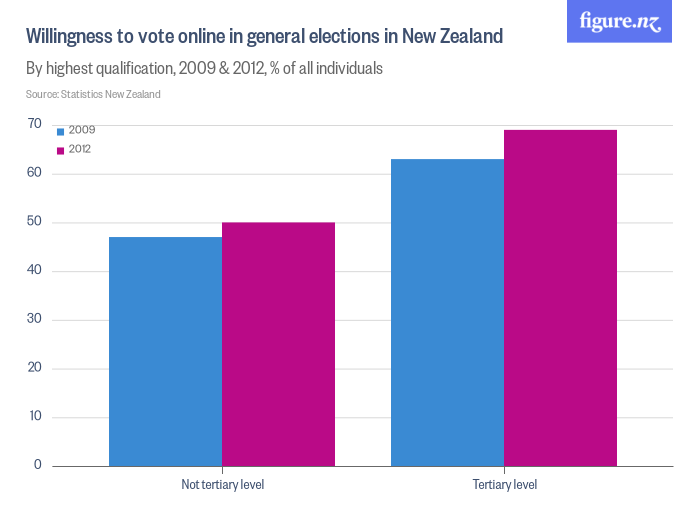
Our insights
New Zealanders who have grown up with the Internet appear to be more comfortable with the idea of online voting and all ethnicities have become more willing to vote online since 2009.
In 2014 and 2015 there was considerable debate about online voting with a number of local councils voting either for, or against taking part in an upcoming trial. We will be interested to see how this debate, and whether the use of online voting technology in the future local elections will affect how New Zealanders feel about voting over the Internet.
How does NZ compare to other countries
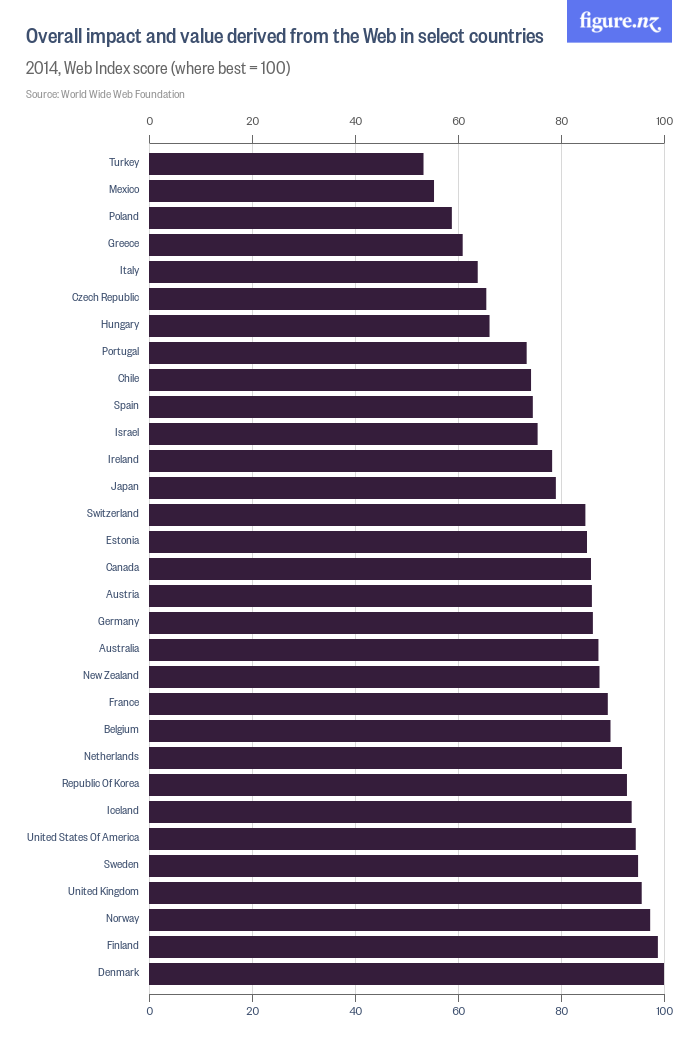
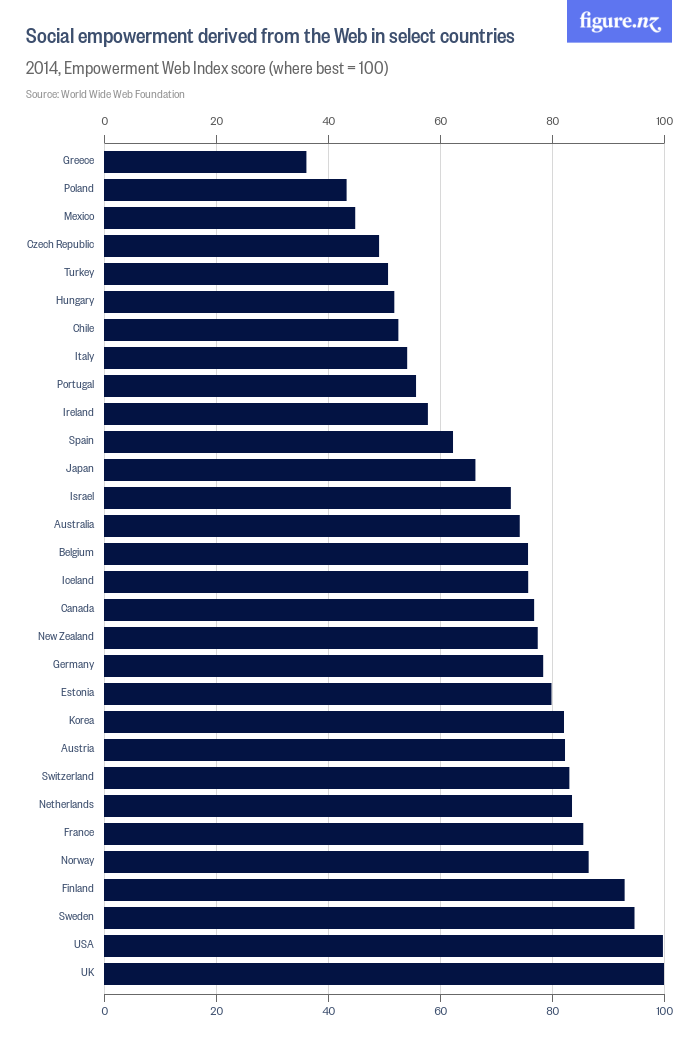
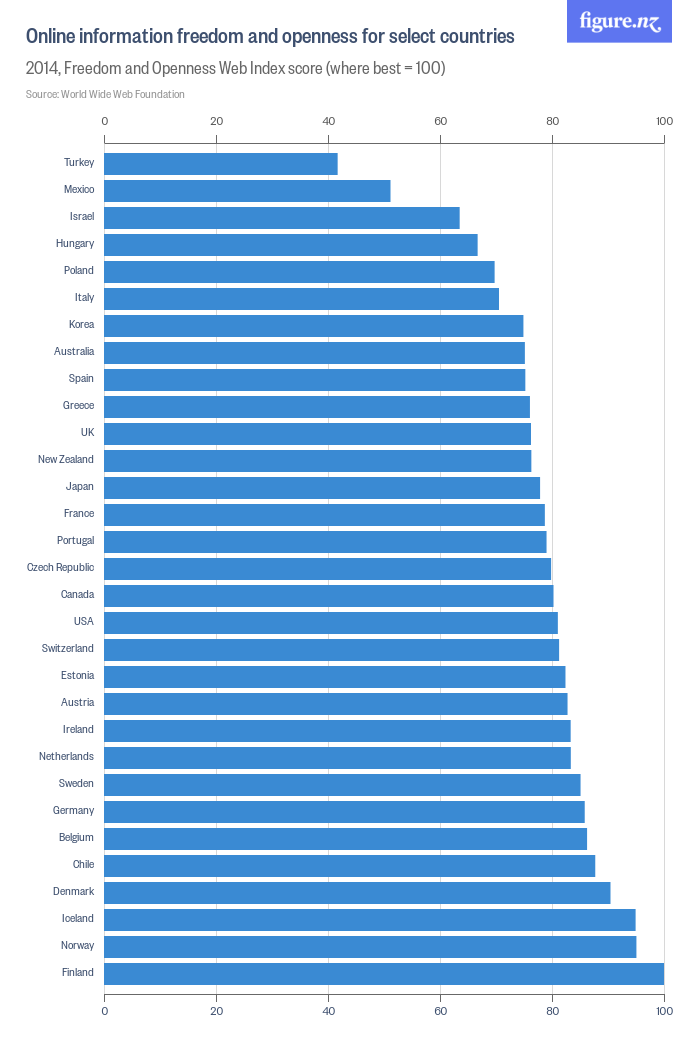
Our insight
'Middle of the pack' is how we would describe New Zealand's performance against other countries on the measures noted above. For Social empowerment (13th), and value (12th), derived from the web we are in the top half of countries assessed. That is good, and something we would like to see New Zealand continually improve on. Worrying to us is the relatively poor comparative performance on openness and online information freedom (20th). As an organisation committed to an open and uncapturable Internet we, of course, want New Zealand to be free and open on the Internet.
For more information on what these terms mean, and otherwise for an excellent resource for information, please visit the World Wide Web Foundation site here:
Government on the Internet
The New Zealand Government has progressed quite significantly on online services and engagement. As mentioned above, it has two targets relating to online services and New Zealand is a member of the 'Digital Five' group of nations that are seen as global leaders in digital services.
So how do we stack up against the rest of the world? What do the stats say?
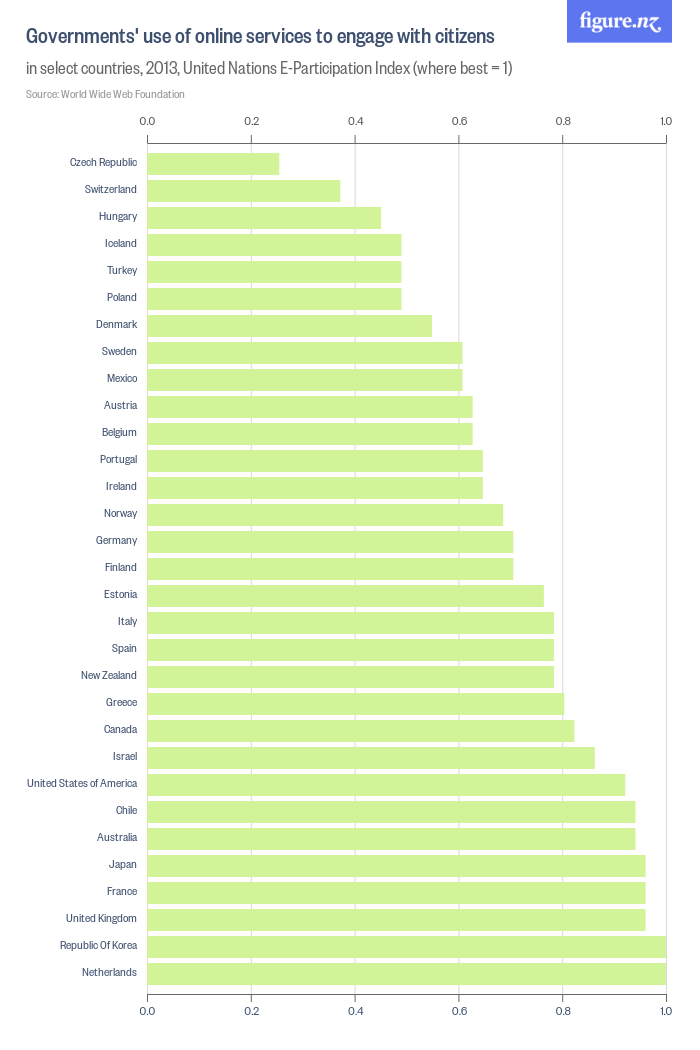
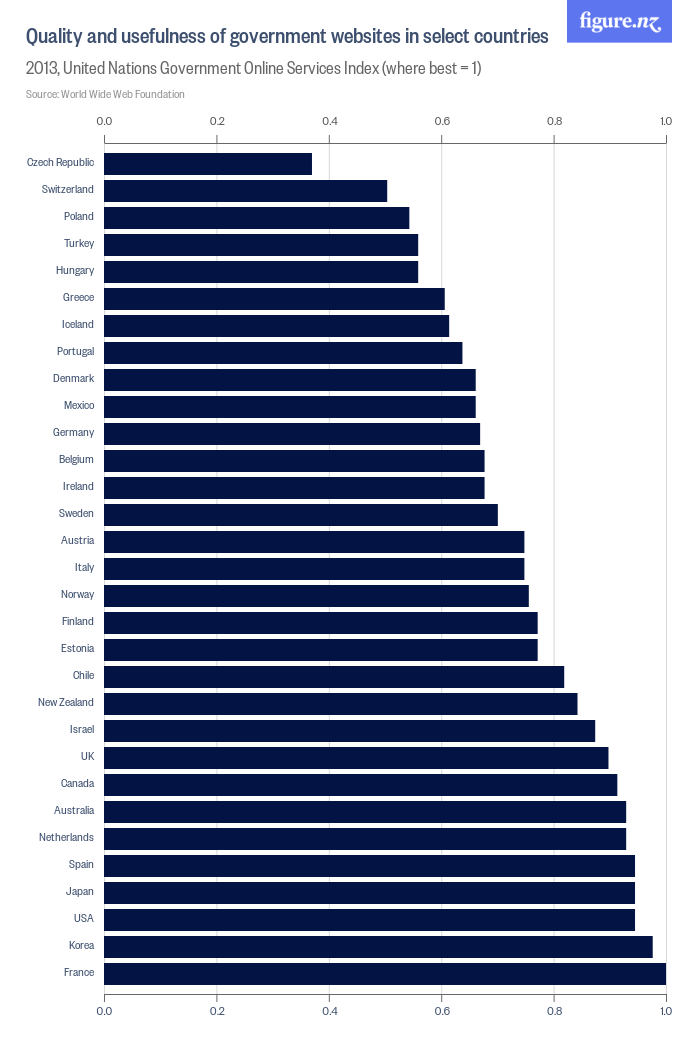
Our insight
In 2013 we were outside of the top 10 nations for use of the Internet to engage with citizens and the quality of government websites (something most of us instinctively nod at). However, there have been a number of improvements since 2013, including:
- the launch of www.govt.nz which is an uncluttered, responsive portal where people can find information about Government services and how to access them; and
- the common web platform which has helped raise website standards and increase consistency.
We are hopeful that the quality and usefulness of government websites will have increased since 2013.
Accessibility
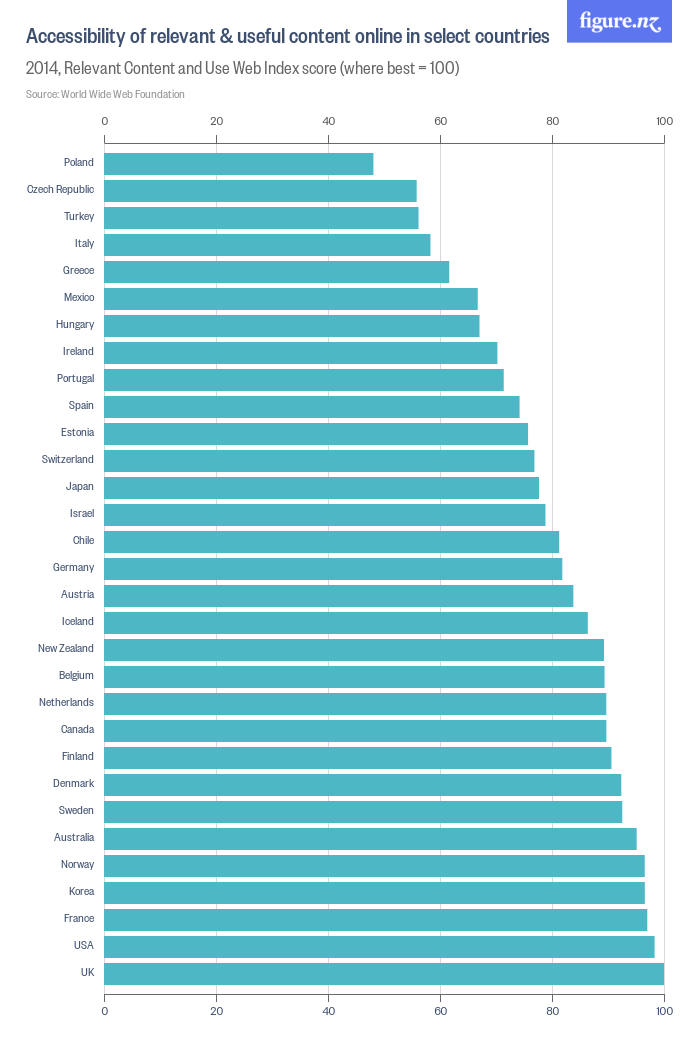
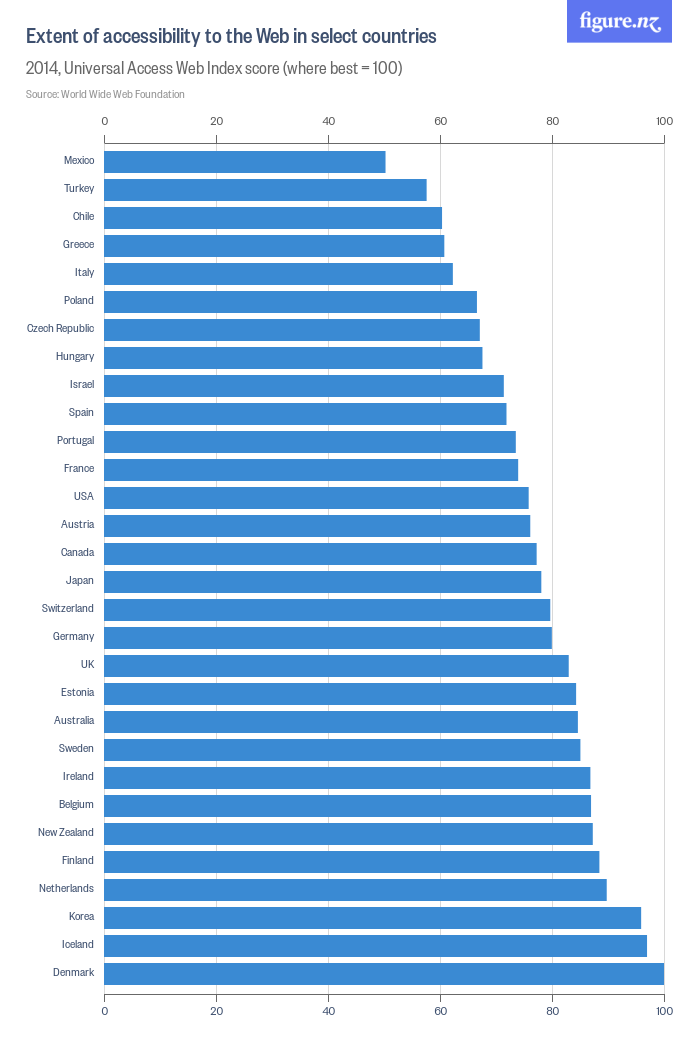
Our insight
These two charts, side by side, indicate that while New Zealand is an OECD leader (6th) on web accessibility, the level to which content is accessible and relevant puts us more in the middle of the pack within the OECD.
This raises a couple of questions about whether our accessible websites are more likely to be 'content light', or if the technical accessibility of New Zealand sites are high, while the complexity of content and language puts things out of reach of people.
More information on these measures can be found from The Web Index site here:
