Part one - How New Zealand accesses the Internet
Measures that demonstrate how we connect to the Internet, via which devices and at what speeds.
The purpose of this section is to take stock of how Internet access is in New Zealand, and to find answers to the following questions:
- What proportion of New Zealanders have connected?
- How are New Zealanders connecting? What technologies do they use, and from where?
- What is our access experience like, in terms of speed and datacaps?
The datasets we’ve collected show some of the answers.
Part one of the State of the Internet Report looks at:
- New Zealand's recent connectivity history
- household connectivity
- regional variations
- why New Zealanders are not connecting
- business connections and needs
- Internet access types
- Internet access technologies
- Ultra Fast Broadband
- mobile Internet
- Internet speeds
- international comparisons.
Part one: Cut to the chase
All the metrics set out in this chapter may be summarised as follows:
- Speeds are increasing as people want more and ISPs get better technology (e.g. 4G, VDSL, Fibre).
- The amount of Internet-based data that households are using has continued to rise.
- Mobile Internet access has become an important component of how New Zealanders access and use the Internet. We are increasingly using mobile access with 3G/4G Internet access used more than wifi by almost all age and income groups. This is consistent with the Internet Society's Global Internet Report 2015 (PDF) We think this is only going to grow with 4G technology becoming more common, the use of 4G spectrum to provide fixed wireless Internet and with 5G on its way.
- Collectively, 50gb/month broadband connections offering 8-24mbps is the most common fixed Internet access experience for New Zealanders.
The information about access, set out in this part of the State of the Internet report has also raised a few questions.
- What are the root causes of New Zealanders who say they are uninterested in the Internet? If they are truly uninterested that is okay, but we are interested to know how much skills, tech savvy, fear or cost concerns are being conflated with a lack of desire to have Internet access.
- What is holding New Zealanders back from moving to fibre?
- How is increased mobility and wireless Internet technology going to change our Internet services markets?
- What datasets do we need to be able to detect the differences between the 'Internet for People' and the 'Internet of Things'?
A history of connectivity in New Zealand
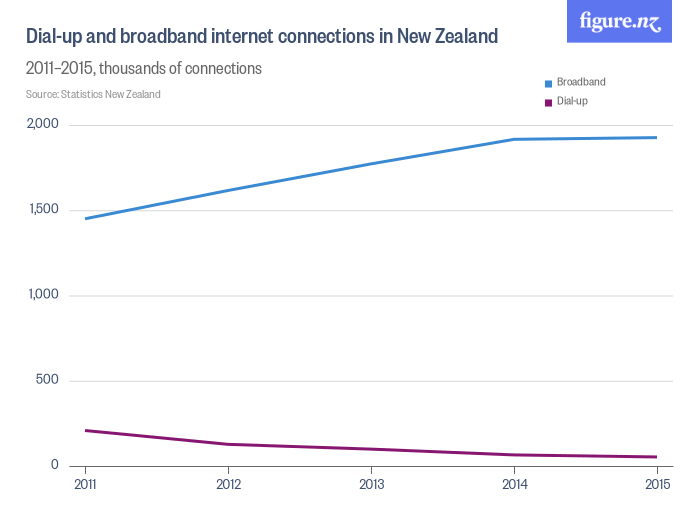
Much has changed already in terms of Internet access in New Zealand. The following chart shows New Zealand’s total uptake of fixed-line broadband connectivity since 2000.
Of course, New Zealanders were already connecting before then; dial-up was far more prevalent than broadband in 2000. In terms of experiencing the full range of benefits and uses of the Internet, broadband uptake is however a more useful metric - higher bandwidth connectivity allows for a richer Internet experience. This data is sourced from Statistics New Zealand, who utilises the following definition for broadband:
“technologies that provide an ‘always on’ service. These include digital subscriber line (DSL), cable, fibre optic, satellite, cellular, and fixed wireless”.
This is important because unlike dial-up connectivity, broadband connections under this definition provide dedicated “always on” connectivity. Dial up connections share data connectivity with standard Plain Old Telephone Service (POTS). Broadband technologies also differ significantly from dial-up due to the speeds that they can handle; usually well below 1 megabit per second in the case of dial-up, whereas depending on the variant of broadband can be well into the gigabit range (when using fibre for example).
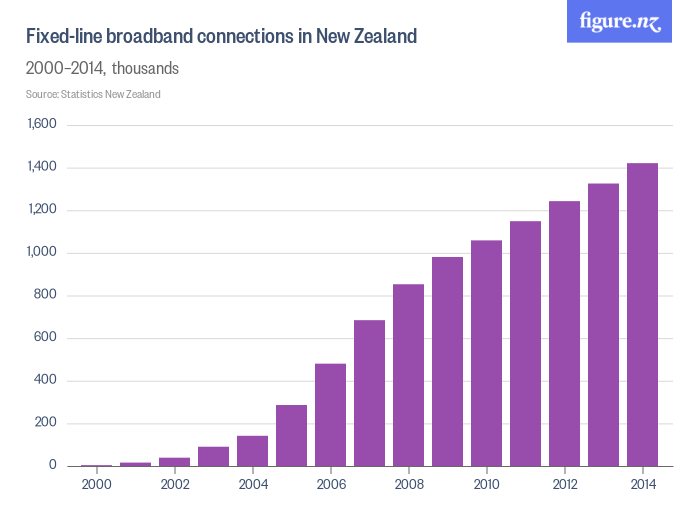
Our insights Broadband Internet access has gone from being a rarely used, niche product in 2000 to well over a million connections.
The following factors are vital contributors to this change in Internet connectivity:
- The overall accessibility of technology that has occurred over the last 15 years is vast. Computers and connectivity are far more affordable now than they were in 2000, and correspondingly the ability for New Zealanders to afford connectivity has also increased.
- We now reap the benefits of competition in Internet provision. Since 2001 and the introduction of a sector specific regulatory framework for telecommunications, there has been considerable change - made more considerable by major Government investments in new Internet infrastructure. These changes have removed the ability and incentive for network operators to discriminate against non-incumbent retail providers, and so have created a far more level playing field for retail competition. At the same time, concentration in the market means that most New Zealand Internet subscribers are served by a very small number of big ISPs, although there remain over 80 Internet Service Providers to choose from. All in all, the degree of competition in the market following fifteen years of rapid change is the subject of different assessments by different investors, network providers, retailers and users.
- Access initiatives have deliberately sought to improve the available options for connectivity. Driving greater connectivity and performance has been another focus of the New Zealand Government’s. The fibre-based Ultra-Fast Broadband Initiative (UFB) and technology-neutral Rural Broadband Initiative (RBI) are the two most recent examples of interventions that have sought to increase accessibility to the Internet.
Accessing the Internet via mobile technologies has also been an area of significant change. The following chart considers 2011-2015, and demonstrates a significant increase in the number of connections.
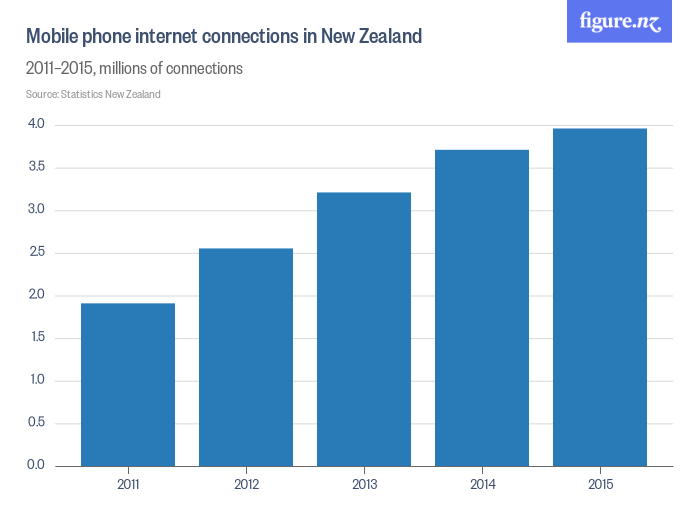
In just four years New Zealand jumped from a rate of roughly every second person having a mobile Internet connection to almost 9 mobile Internet connections for every 10 New Zealanders.
There are a number of likely explanations for this rate of increase:
- We wonder how many mobile phones sold these days are not Internet-connected computers? How many are 'dumbphones' that just call & SMS? Our observation is that it is unlikely to be very many devices at all that don't include some form of data connectivity. It is highly likely then that this mobile phone internet connections data is indicative of the wider mobile Internet revolution in New Zealand.
- Increasing competitiveness, again, is a likely factor in lowering prices and therefore increasing affordability of services. For example, in the period considered in this chart, Skinny Mobile (a prepay brand of Spark New Zealand) launched in 2012 with what they claim is New Zealand’s lowest prepay rates.
- The Commerce Commission has considered many of these factors in their Study of the Business Mobile Market Segment in which the Commission concluded:
“… respondents believed the business mobile market was competitive compared to other industries. The majority of businesses surveyed were satisfied with their main mobile provider and only a small proportion (fewer than 15 percent) was actively looking to switch or would consider doing so when their contract was up. When selecting a mobile provider, respondents said reliable coverage, good customer service and price were the most important factors”.
Clearly, New Zealanders are accessing the Internet more. The next sections of this chapter consider various other metrics to understand more about the nature of Internet access in New Zealand, including:
- household-based access measures
- analysis of access technologies used
- analysis of customer device technologies used
- speed outcomes of access; and
- barriers to access.
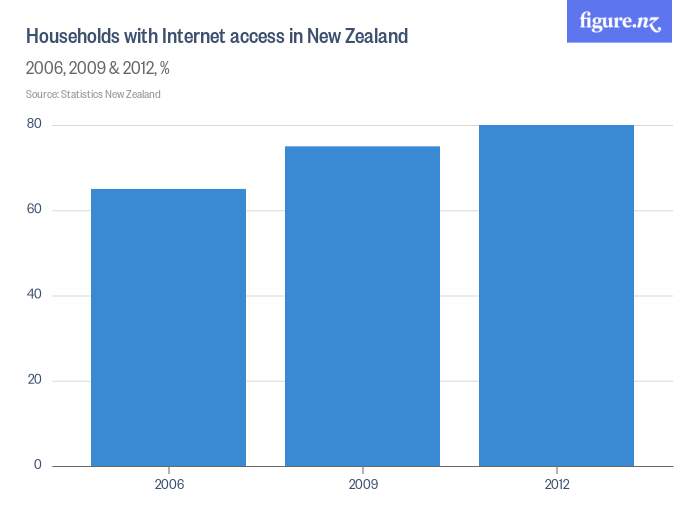
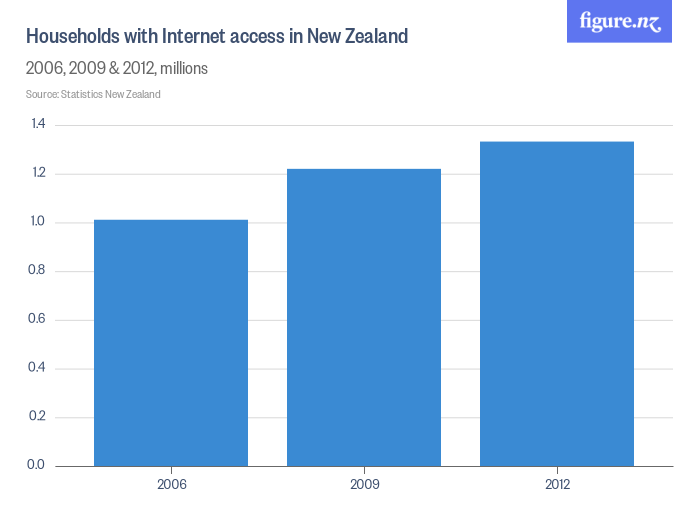
Household connectivity
In understanding how New Zealanders access the Internet, household-based measures are useful because they take into account how connectivity is shared in homes, a common scenario for New Zealand families and people living in shared-living arrangements. When considered in terms of digital divides, or how many New Zealanders are able to access and utilise the Internet, then household connectivity for as many people as possible is considered to be an excellent outcome to target. This is simply because household connectivity is regularly available and capable of supporting a full Internet experience - both creatively and for usage.


Our insights
There are some simple insights that this data supports. Clearly the earlier insight about increasing access to the Internet is supported at a household layer as well, in that over the time periods covered in this analysis, household broadband access to the Internet has increased significantly.
What is more interesting is the data that demonstrates the rate of change in broadband connectivity versus the total number of households, and the changing nature of access mixes in these households. Despite the impressive rate of change shown in this household uptake data, it is a concern that there remains 20% of New Zealand households that are not connected to the Internet.
This data highlights what may be a remaining challenge for New Zealand in terms of deriving benefit from government investments in greater connectivity, and that is focusing on the availability factors of Internet access. The UFB and RBI initiatives are delivering greater connectivity and performance to New Zealanders and households. This data predates the common availability of these initiatives, which may demonstrate how they may change the rate of uptake and growth in Internet connectivity. Future data will show the impact of these initiatives, as will future editions of this State of the Internet Report.
Regional variations
There are also significant regional differences in Internet access, and how this differs from telephony access.
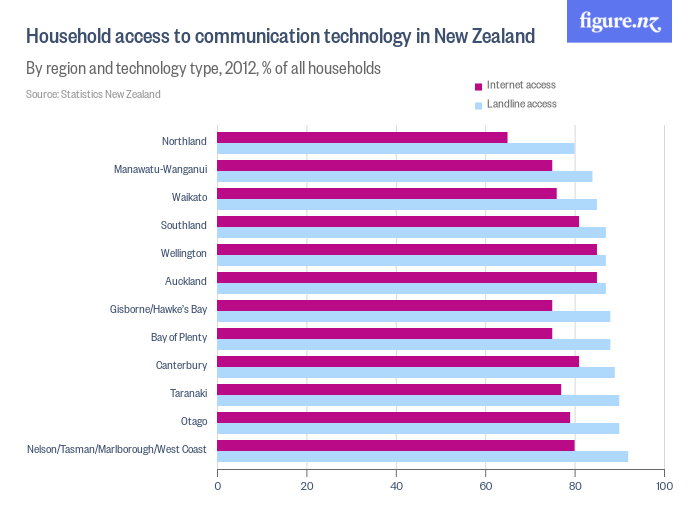
This data shows that outside of Auckland, Wellington, and to a lesser degree Southland, where nearly all landline users also have internet access, there is a reasonable difference between telephony uptake and Internet uptake. As to why, we are not sure. There may be both socio-economic reasons for this, but also population age distribution may also be playing a role here. This data suggests an opportunity for more research into why rates of uptake of the Internet in different parts of the country differ, and why certain users maintain connectivity for the purposes of calling only rather than adding Internet services to these telephone connections.
Why are New Zealanders not connecting?
What are the barriers to access? Is not having Internet available still the biggest roadblock to getting New Zealanders online?
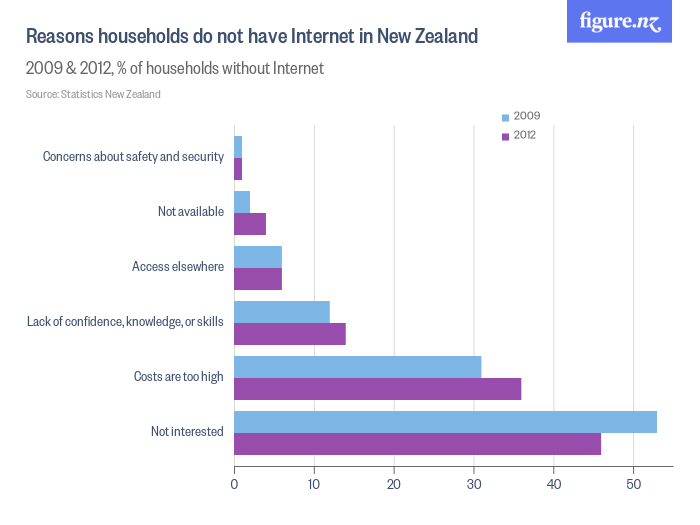
Our insights
The charts above demonstrate that “not available” is not the key challenge in terms of Internet access across New Zealand. Instead it appears that the cost of services and a lack of interest in connectivity are far more important factors.
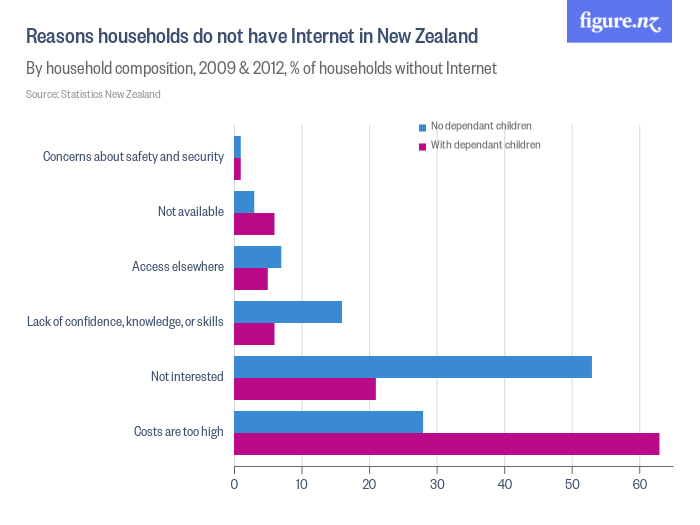
Whether cost of services is a factor appears to be linked to whether the household has dependent children. In households with dependent children, this data indicates that cost becomes far more an issue. For households without dependent children, it is interest in getting online that is the greater barrier.
Despite the impressive and necessary investments made by the Government in improving connectivity options, these challenges of cost and the value that New Zealanders place on Internet access are highly likely to remain.
Aside from participating in regulatory proceedings to help ensure that New Zealanders pay fair and reasonable amounts for connectivity, we have also supported a number of community-based initiatives that have sought to understand the cost challenge in Internet access, through different network deployment tests and new research that seeks to understand the problem more clearly. Two such examples of this work are:
- InternetNZ part funded a report by Telco2, called Broadband Affordability in New Zealand. This report concluded that while Internet affordability in New Zealand by and large conforms with International standards, that there remains a challenge particularly for hard to serve areas supported by Satellite technologies.
- InternetNZ has also provided funding to support the Mitimiti on the Grid project, connecting a rural marae based community to the Internet. This project has delivered a number of “firsts” that are impressive; as stated by the project:
- it was the first marae in the country to be included in the Government's RBI roll out
- it was the first deployment of the 2km range femtocell, a localised cell phone coverage device. The cell phone signal can be accessed in any unobscured direction for up to 2kms - called “line of sight”.
- It was the first marae to pilot remote Internet and wifi management with a view to a building a remote management system for other marae in future
Building interest in connecting to the Internet is a very different and harder challenge to address. In one sense, it is not an issue; if there are New Zealanders that simply do not wish to share in the benefits and uses of the Internet then that is a valid response that will not be addressable or changeable.
There is however some anecdotal evidence to the contrary however; that some not interested responses are due to not having the confidence to use in a manner that would make them more interested, or that simply it is not something that is understood sufficiently to value.
An example of such anecdotal evidence is in the support that the Innovation Partnership has provided supporting the Manaiakalani initiative, promoting connectivity in schools. Part of that initiative is to provide free connectivity to the school community around it to enable students to continue to learn in the home environment. As a result of that connectivity being present in the home, paid penetration of broadband has increased from approximately 40% of these homes to over 70% - all from families moving from “not interested” and “costs are too high” to valuing connectivity more and prioritising it accordingly.
There remains a challenge to demonstrate the value of connectivity to some New Zealanders. This will not solve the problem of people not being interested in the Internet. But it will allow clarity around how many of those may be interested if provided different opportunities.
Business
Data on business access is sparser in the sources utilised for this State of the Internet report. However, we are very interested in how New Zealanders are using the Internet for their businesses.
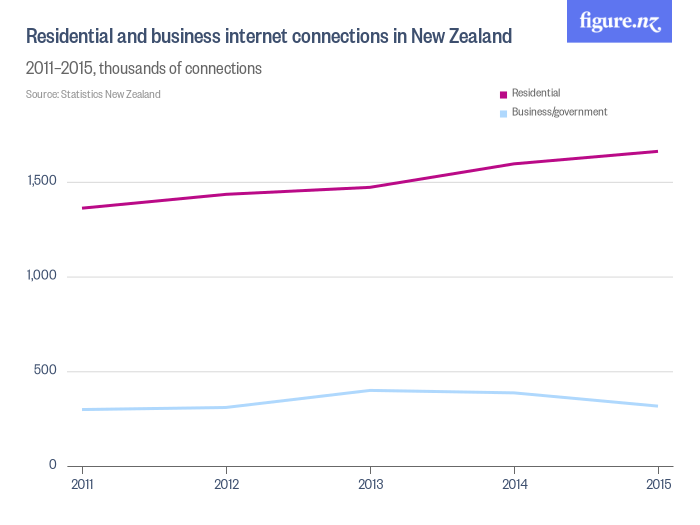
Our insights
The chart above shows an unexpected and perhaps worrying trend. While residential connection to the Internet continues to grow, Internet connections by New Zealand businesses and Government are static or declining. Since actual use of the Internet is clearly not declining, one explanation could be that fewer small businesses are classifying their primary Internet connections as “for business”. More data and research is clearly needed to improve our understanding of the challenges in connecting New Zealand businesses.
InternetNZ has undertaken research with the Innovation Partnership on a report entitled The Value of Internet Services to New Zealand Businesses.
Research released by the Innovation Partnership shows that everyday Kiwi businesses could add $34 billion to the New Zealand economy if they made effective use of the Internet.
Businesses that make effective use of Internet services are six per cent more productive than average businesses in their industry. Many New Zealand businesses are using online tools to find new customers, improve their data collection and customer service, and do their work in the cloud. These high-users are 73% more productive than businesses that make little use of the Internet. This research shows that effective business use of the Internet remains as important as connecting to the Internet itself.
Find out more about the report here:
Find out how Kiwi businesses are unlocking the potential of the Internet in their businesses:
Access types
What types of devices are New Zealanders using to access the Internet? Has the arrival of smartphones, tablets and the introduction of 4G changed how we access the Internet?
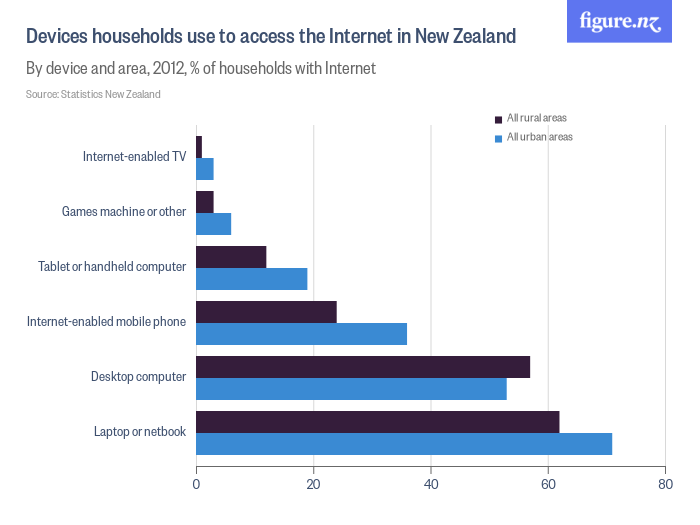
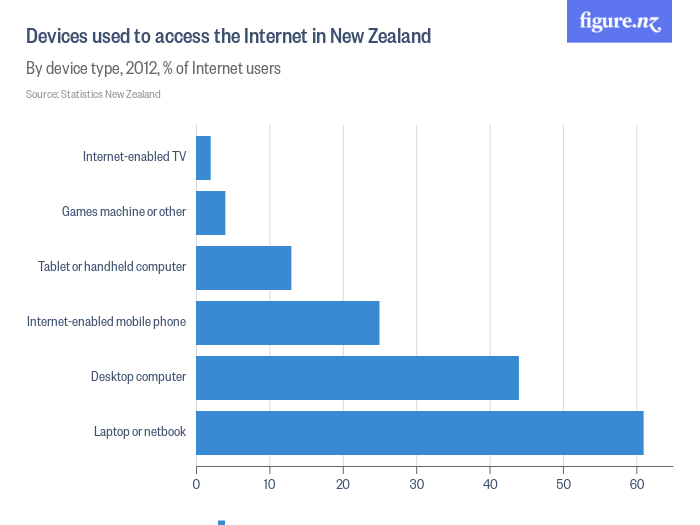
Our insights
One trend is immediately notable is the trend towards increasing mobility in connectivity. The high rate shown in mobile phone use for example corresponds with international trends, and the preference for laptop or notebook connectivity over desktop also corresponds. Mobility is an increasingly important part of the Internet experience in New Zealand, and as mobile networks continue to lift in terms of performance then this trend is likely to continue. Recent reports, such as that from the Telecommunications Forum, have shown that New Zealand's rollout of 4th Generation (4G) mobile technologies such as LTE is world leading.
A summary of the Telecommunications Forum's report is available here (PDF):
Telecommunications: Enabling New Zealand's Future
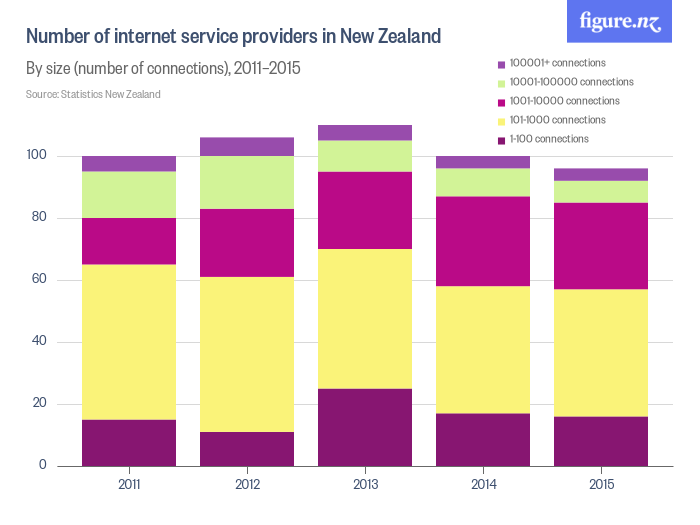
Our insights
The ISP market in New Zealand is already highly concentrated; over 95% of connections are with Spark, Vodafone and the various companies that operate under the M2 New Zealand/Vocus New Zealand group of companies. This consolidation in the industry is again a trend that has been observed overseas; the changing nature of Internet service provision in terms of providing connectivity at ever sharper and more competitive margins is encouraging consolidation, whereas the requirement for ever greater investment in value added services requires scale in these businesses.
While numbers of ISPs remains high, the level of competition between diverse providers is less assured. More research could investigate the extent to which smaller ISPs are making niche offerings to secure their customer bases as a means of differentiation, and therefore competing, against the larger ISPs.
Access technologies
The nature of New Zealand’s Internet access is changing in terms of the technologies that people use to get online – with the type of networks they connect to, and the devices that they use to do so.
In this section of the report, we consider how these different technologies are being utilised in New Zealand.
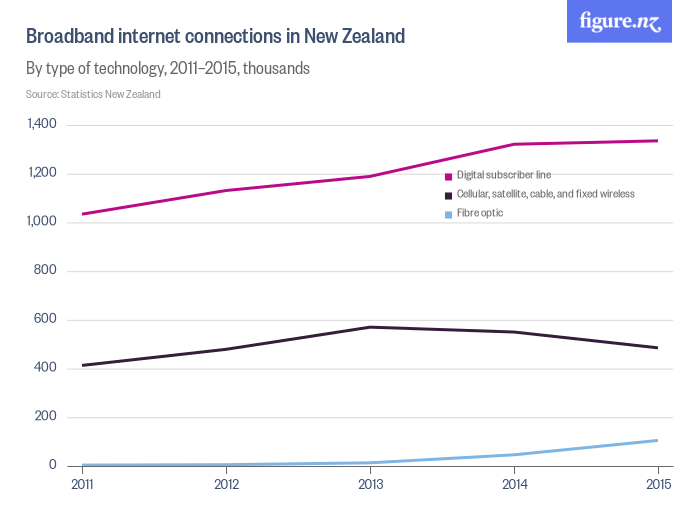
Our insight
Digital Subscriber Line (DSL) encompasses a range of different technologies, all based on the legacy copper infrastructure deployed all around New Zealand. The uptick (in absolute terms) of DSL connections may be due to the increased availability of newer, Very-high-bitrate Digital Subscriber Line (VDSL) technology that has become available in New Zealand recently. VDSL is capable of delivering speeds of up to 52 megabits per second (Mbit/s) downstream and 16 Mbit/s upstream over copper technology (though real experiences will differ significantly from these headline speeds). This compares to the traditional version of DSL deployed in New Zealand, Asymmetric Digital Subscriber Line or ADSL, which can deliver up to 24 Mbit/s down and 3.3. Mbit/s up, depending on the particular variant deployed.
DSL-based technologies remain dominant through 2011-2015, while cellular, satellite, cable and fixed wireless connections have lost ground in terms of the total connectivity mix in New Zealand. Fibre is starting to show up in these measures, but this data pre-dates mass market uptake of fibre technology that will likely show through in Statistics data for 2015. We anticipate the traditional s-curve for fibre adoption based on the experience of other countries that have rolled out fibre-based networks.
One conclusion that this data supports is that in most cases, Internet users will default to the best performing technology available to them. There have also been concerted efforts by the Government to bring higher bandwidth capable technologies to more New Zealanders – for example, shifting users from copper-based technology to fibre connectivity through the UFB, and shifting rural users from satellite to improved fixed or fixed wireless connections.
Finally, it is no surprise that dial-up technology continues to diminish in prominence in these statistics. Most dial up connections are capable of 56 kilobits per second (Kbit/s) – or around 0.05 of a megabit. These connections are capable of only the most basic of connectivity; even most online email solutions will struggle to provide content via a connection like this. Any lingering use of connections like this is likely due to either very low usage or price constraints versus purchasing broadband connections, or the share unavailability of other broadband options.
UFB
UltraFast Broadband (UFB) is New Zealand’s modern fibre-to-the-home Internet access technology. The new UFB network(s) are still being built and rolled out across the country.
We see the relevant questions about access for UFB as the following.
- Are New Zealanders taking up UFB once it is available?
- Are the UFB networks producing the dramatic speed increases that New Zealanders want?

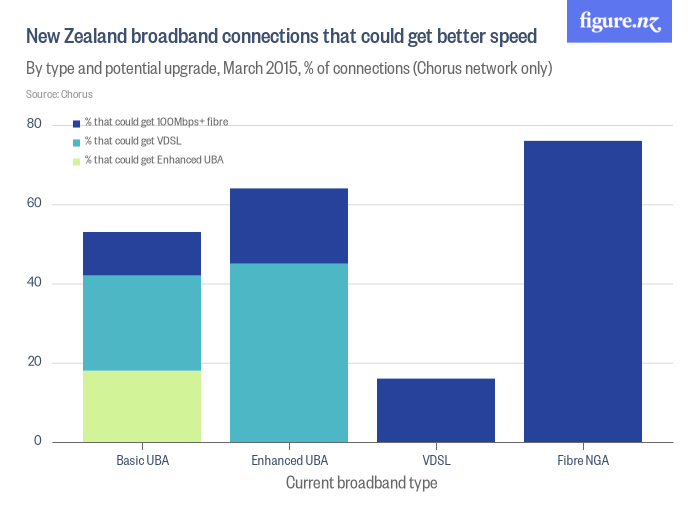
Our insights
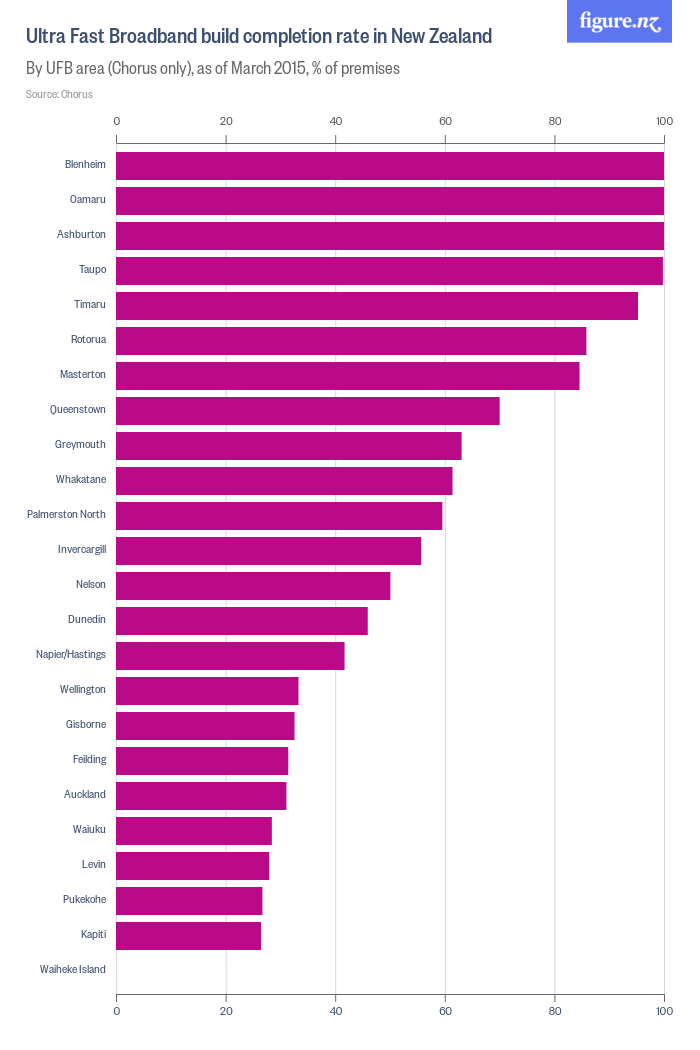
The progress that the Government has made in improving technology through the Ultra-Fast Broadband (UFB) is outlined above. The UFB is an exciting programme that will provide the majority of New Zealanders with vastly improved connectivity, provided through future-proof fibre infrastructure.
As this data shows, rollout is relatively impressive with seven regions over 80% deployed and of those four fully completed as of March 2015. This impressive pace in these areas contrasts with the progress made particularly in larger rollout areas – Auckland and Wellington both for example under 40% deployed; Dunedin at under 50% (Hamilton and Christchurch are not included in this data due to their rollouts being managed by UltraFast Fibre Limited and Enable Networks Limited respectively).
Of course, there will always be areas that come first and some that come later in a build programme that runs for 10 years. These larger areas also have a far larger population, and therefore more households and connections to manage. Indications are that all providers of the UFB will complete the build on time as per their commitments to the Government, by 2020.
Rollouts are wholly in control of providers, their contractual commitments and their project management methodologies. Uptake is a more interesting metric as this indicates to what degree New Zealanders understand and appreciate the benefits of higher quality connectivity.
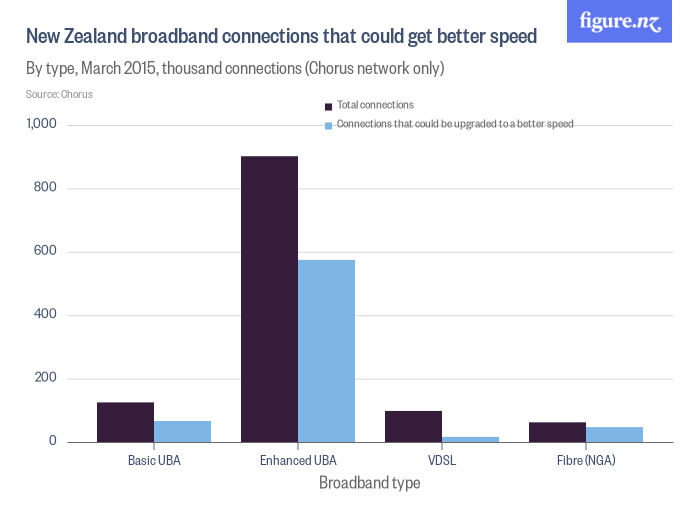
What we see in the next chart is that as of March 2015, there is still a long way to go in connectivity to the UFB. Across Chorus’ UFB network uptake is below 15% of those premises where UFB is available. In other words and approximately only one in seven of those able to connect to the UFB are doing so thus far.
While this shows that there is still a long way to go in connecting people to fibre in New Zealand, there is argument that this is progressing about as well as should be expected. There is evidence that suggests that fibre uptake enquiries surge as the particular coverage area is completed in terms of rollout, which suggests that part of the sales challenge is communicating to people that yes, they can now connect. There are also ongoing issues with the rates of connection being higher than Chorus has planned for in some areas, and workforce capacity constraints limiting Chorus' ability to meet demand for fibre in the short and medium term.
This will be an important metric to keep track of as the UFB winds on – both in terms of understanding whether rollout commitments are being met, and also in terms of whether New Zealanders are taking the opportunity to improve their connectivity. The latter may be an area of more challenge than realised.
Speeds
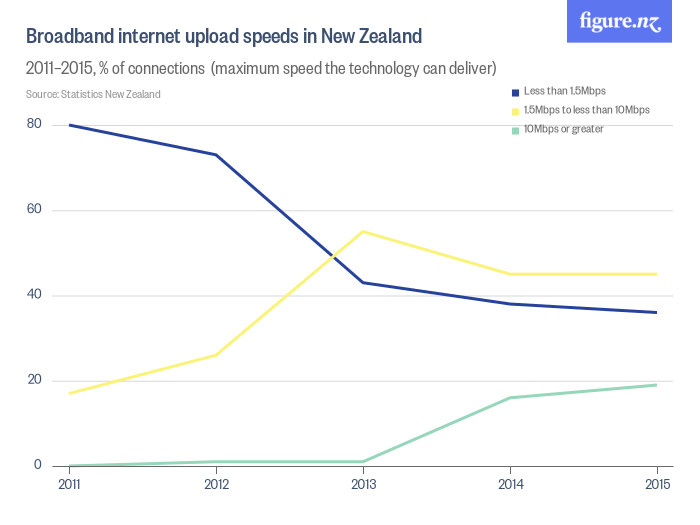
What download and upload speeds do New Zealanders experience?

Our insights
Looking at these graphs, it is striking that there has been a rapid move away from low bandwidth connectivity options. A shift of over 40% of connections in two years is a significant change in the way in which New Zealanders are accessing the Internet. As a result of this change, most New Zealanders have a relatively consistent experience of the Internet, with seven in ten connections pulling 8-24 mbps download speeds and that the number of New Zealanders getting faster upload speeds has dramatically increased over the last two years. This is most likely due to the rollout of fibre Internet connections, and the increased availability of more advanced copper technologies such as VDSL.
Our insights
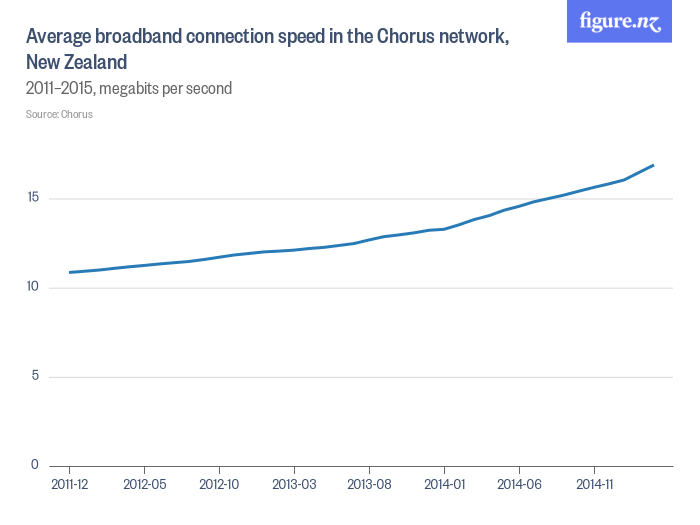
One of the other observable impacts included in these datasets is increased speeds experienced by New Zealand Internet users. Speed is one of the most relevant metrics to business and consumer users of the Internet alike, as it simply makes using the Internet far more useful and enjoyable. This is particularly true given how much Internet traffic is now driven by higher volume uses, both in a productive and consumptive sense. For example, video content consumption requires higher bandwidth, meaning speeds amongst other things, to deliver at high video quality. Likewise, many creative uses of the Internet also require high bandwidth in order to support efficient delivery of created products.
This data shows that Internet speeds in New Zealand are clearly changing, and markedly. Given the uptake of connectivity in the UFB is just starting, the impact of this initiative is not likely to be a major contributor to these datasets as yet. That will likely become a larger factor in future years of this State of the Internet report, as most users sign on to at least 30mbps downlink speed plans, and as a significant number sign on to 100mbps plans.
More likely is that this change is driven by new technology availability. Very-high-bitrate Digital Subscriber Line (VDSL) is likely playing a part in this story. VDSL technology has recently been deployed by Chorus and made commercially available by a number of ISPs in the last few years. VDSL, theoretically, offers up to 52mbps down and 16 mbps up, and therefore is a markedly improved experience over traditional copper technologies such as ADSL. It also compares very favourably to fibre connectivity, particularly when many New Zealander are signing on to the most basic 30mbps fibre product being built as part of the UFB programme. Indeed, InternetNZ has heard that many ISPs believe VDSL to be a “stepping stone” technology, moving customers to higher speeds until fibre becomes available.
International Comparisons
Connections
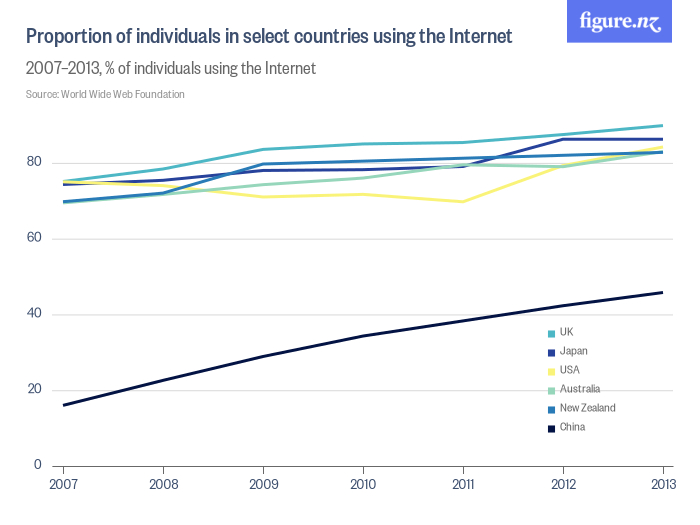
Our insight
Over 80% of New Zealanders are using the Internet, which is comparable to other nations compared by the World Wide Web Foundation. This chart shows that our rate of change on this metric is continuing to keep us in a similar position relative to these peers.
Fixed line connectivity
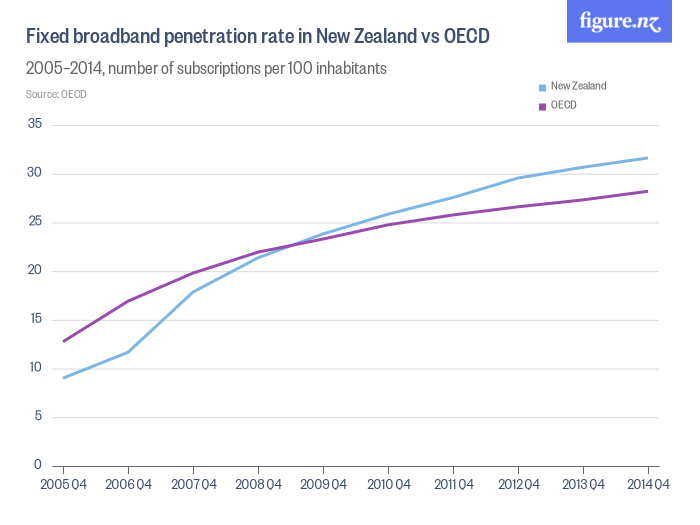
Our insight
New Zealand is performing above the OECD average, a story that has significantly changed over the last 10 years. The ongoing rate of change in New Zealand also suggests that New Zealand’s performance in this regard is continuing to outpace that of the OECD average. If that is the case, then New Zealand should rise up the earlier rankings over time. It is notable that the change in these rankings occurred after significant legislative and regulatory change in New Zealand; change that was designed to increase the competitiveness of the domestic telecommunications market.

Our insight
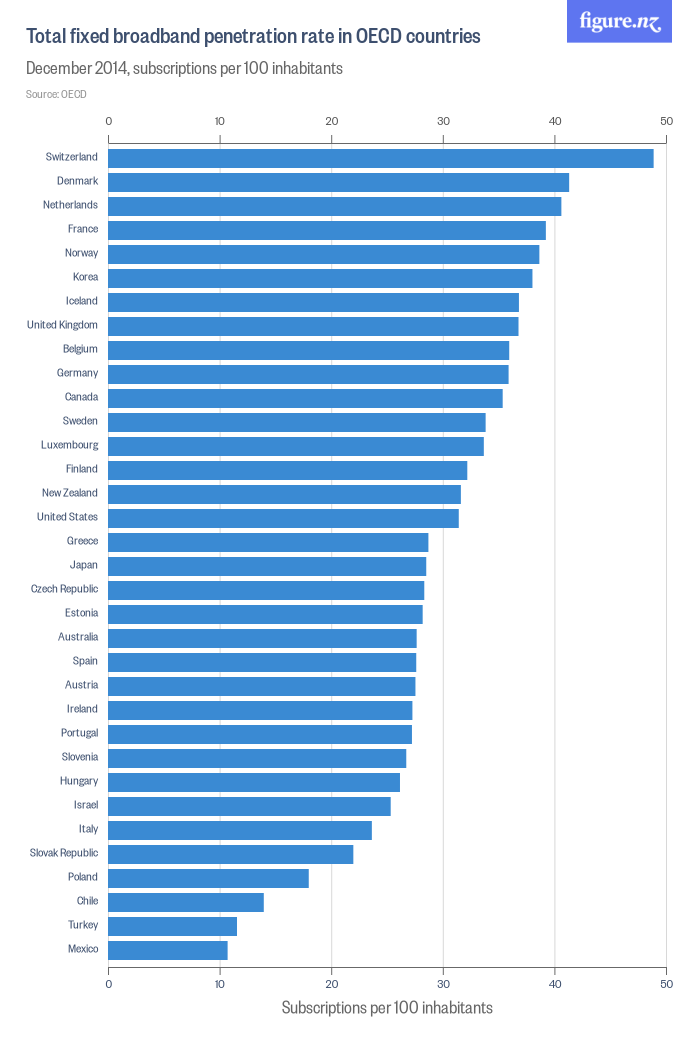
In terms of total fixed broadband penetration, New Zealand ranks 15th out of the 34 OECD countries. Note that this comparison is likely an outcome of household size, rather than of actual connections. That is because fixed line broadband is most commonly installed into properties and utilised by multiple users thereafter. This explains why this measure is not as high as might be expected, but does not explain why New Zealand ranks the way it does versus similarly developed countries.
However, when individual rates of growth are compared, New Zealand’s recent speed is not high performing at all. Many of these countries are moving off a lower base – but some, like Switzerland for example, are already high performing in terms of total connections per 100 people. This particular metric may change as New Zealand’s fibre broadband connectivity increases. This is a particular area to keep watching – or alternatively, to consider what we can learn from the likes of Switzerland in terms of continuing to add connectivity when already at high levels of connectivity.
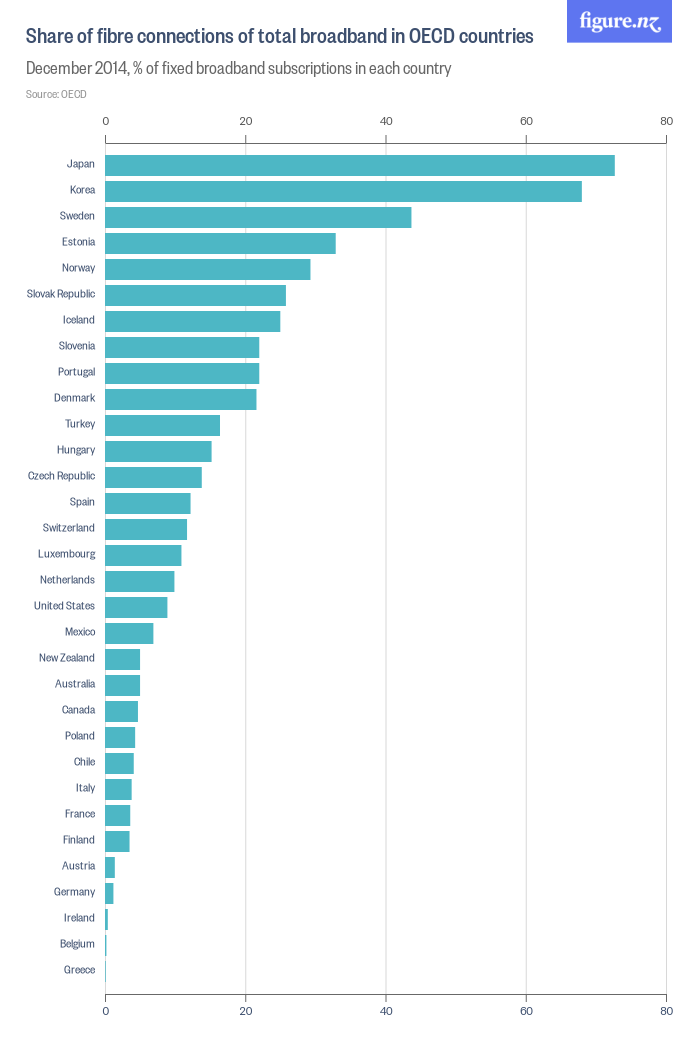
This is one area where change is likely to be quite dramatic over the next few years. As New Zealand’s Ultra-Fast Broadband initiative continues to rollout around New Zealand, the number of fibre based connections as a proportion of total connectivity should change markedly.
Wireless and mobile comparisons
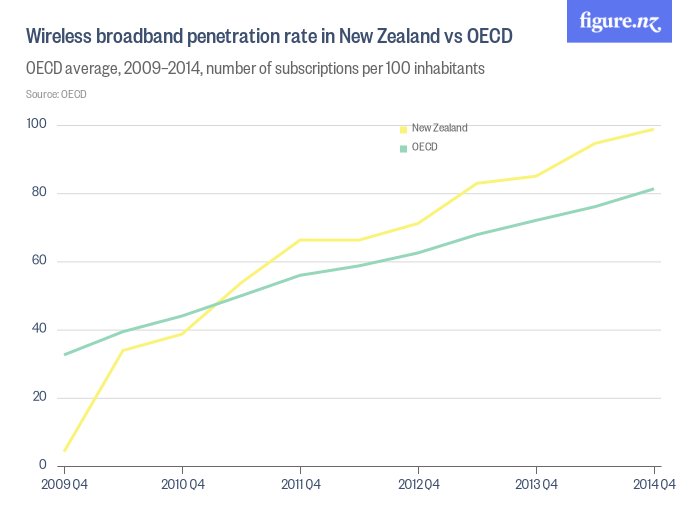
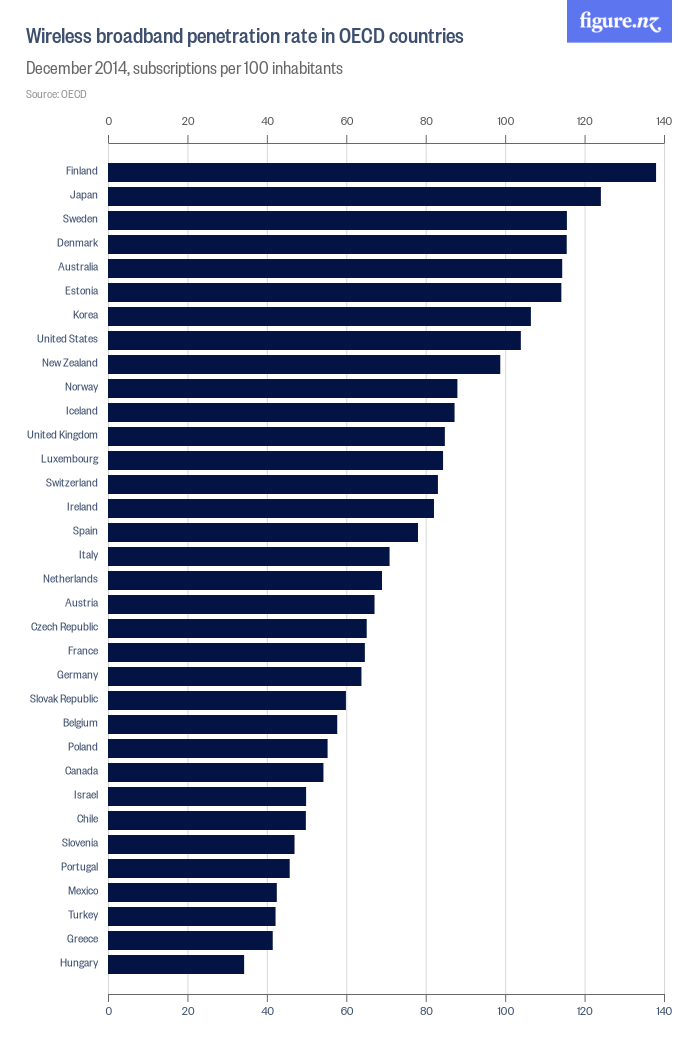
Our insight: Wireless broadband penetration has been a success story for New Zealand over the last five years. We have dramatically increased the penetration from near zero in 2009 to near 100 now – a rate of change far in excess of our overseas peers. This increased penetration has meant that not only are we above the OECD average, we are 9th placed with the equivalent of nearly one connection per inhabitant.
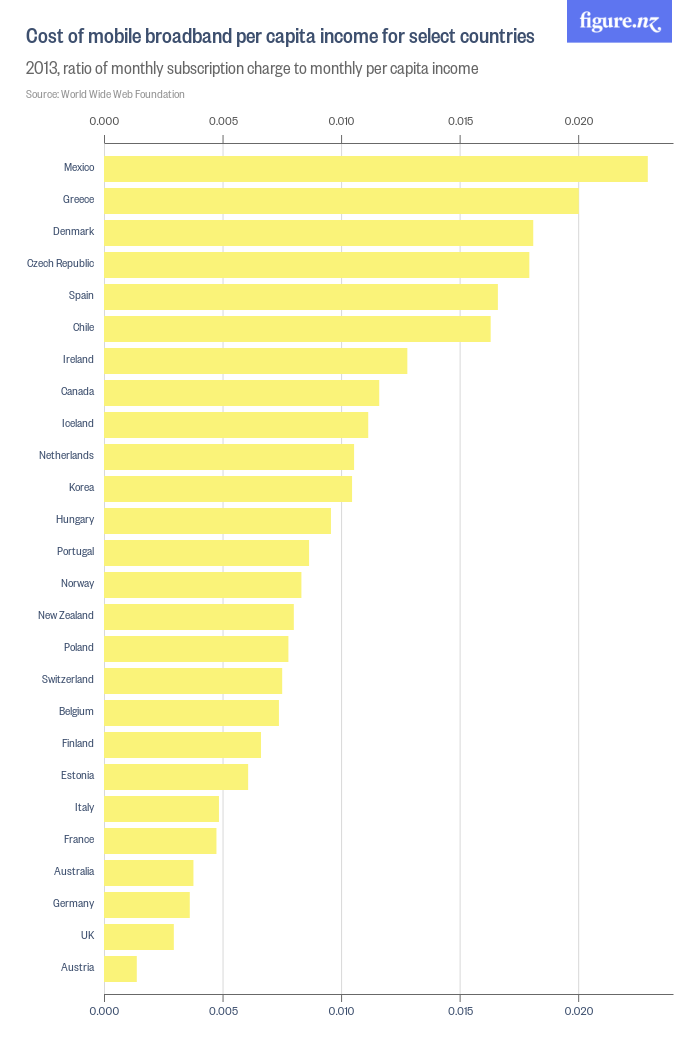
Our insight This data indicates that in terms of other OECD countries, mobile broadband in New Zealand is rather affordable, in the lower half of this OECD sample.
This demonstrates two things. Firstly, the power of introducing competition into the New Zealand mobile market, particularly since the launch of 2Degrees, leading prices lower than our peers. Secondly, it shows that there is still room for improvement – the United Kingdom for example having pricing on average less than half the per capita amount than New Zealand. It would be interesting to consider this data over time, and future editions of this State of the Internet Report will seek to incorporate more data to explore this area.
Under-access and digital divides
This section has covered access. But what about the idea of under-access? We've seen an explosion of mobile devices being used. But, without a home broadband Internet connection (& wifi to serve multiple devices) many New Zealanders are dependent on mobile data, which is not cheap.
Recent research from the US shows has highlighted issues relating to low-income families having limited access to the Internet due to a reliance on mobile networks.
However, this access is unequally distributed. Although nine out of 10 low-income families have Internet access at home, most are underconnected: that is, they have “mobile-only” access – they are able to connect to the Internet only through a smart device, such as a tablet or a smartphone.
The Conversation: Many low income students use only their phone to get online...
The big disadvantages of a mobile phone are the high price of mobile data - especially on prepay phones and that the screen and keyboard are not conducive to doing large amounts of serious study. If someone can only use a mobile phone to get online, and they can only afford 500mb/month, are they really able to access the Internet and leverage its potential?
We do not have any graphs or figures (yet) on under-access or digital divides. However, in 2016/17 we will be working to understand New Zealand's digital divides so that we can better understand the problem, and what potential solutions could work.
